Individual/Combined used tools: Power BI, Power Query Editor
Contexts:
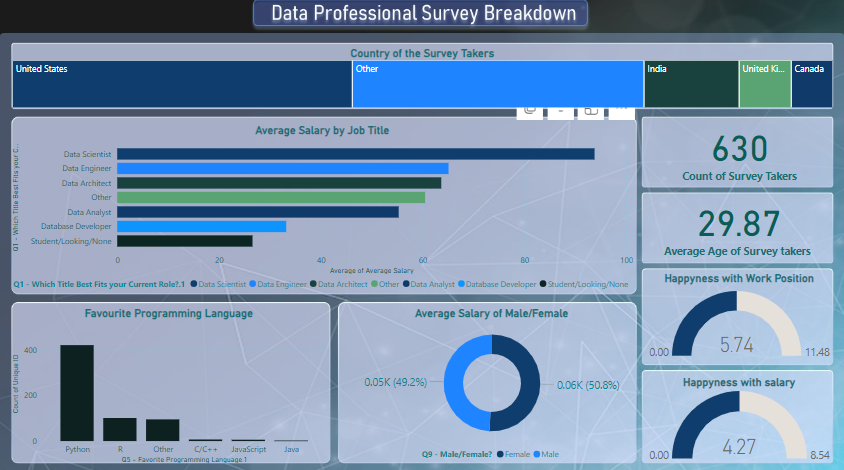
Workforce satisfaction in the data industry
Salary distribution and preferred programming languages among data professionals
Findings:
Data scientists have the highest average salaries among data professionals
Most data professionals are satisfied with their work-life balance
Python and R are the most widely used programming languages in the field
Role: Data Analyst: Conducted data cleaning, analysis, and dashboard creation
Data source: Survey results from 630 data professionals, including variables related to salary, job satisfaction, work-life balance, and programming language preferences
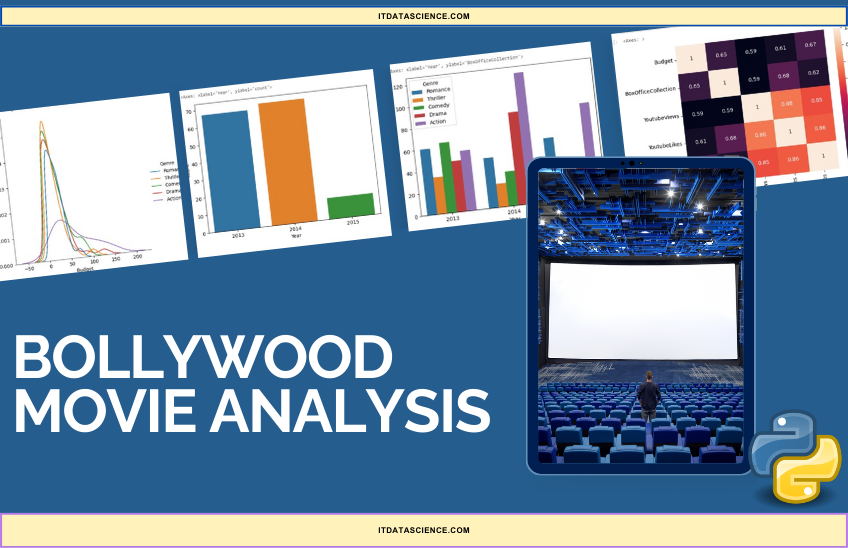
This project showcases my proficiency in Python, utilising libraries like NumPy, Pandas, Matplotlib, and Seaborn for data analysis. The focus was on extracting key business insights, such as identifying profitable years, assessing the impact of release timing, and analysing correlations to support strategic decision-making.
EDA-with-Python
Project name: Exploratory Data Analysis(EDA)
Individual/Combined used tools: Python (Pandas, Matplotlib, Seaborn)
Contexts:
Understanding key characteristics of automobile data, such as fuel efficiency, engine size, and vehicle weight
Exploring correlations between various attributes to reveal insights about the automobile market
Findings:
Strong negative correlation between miles per gallon (mpg) and vehicle weight, cylinders, and displacement
Origin 1 (likely representing the U.S.) dominates the dataset, with the majority of vehicles originating from there
The number of cylinders and engine displacement are positively correlated with vehicle weight
Role: Data Analyst: Conducted data loading, cleaning, visualisation, and analysis
Data source: A public automobile dataset (Auto.csv)
Dataset: The dataset contains 397 entries with 9 attributes, including mpg, cylinders, displacement, horsepower, weight, acceleration, year, origin, and car name.
This project involved conducting an exploratory data analysis (EDA) on an automobile dataset using Python. By analysing various attributes like mpg, cylinders, displacement, and weight, I uncovered correlations and trends that provide insights into vehicle performance and design. Visualisation techniques such as histograms, scatter plots, and boxplots were used to better understand the data distribution and relationships.
Call Centre Dashboard
Individual/Combined used tools: Power BI
Contexts:
Analyzing call center performance metrics
Improving customer service efficiency through data-driven insights
Findings:
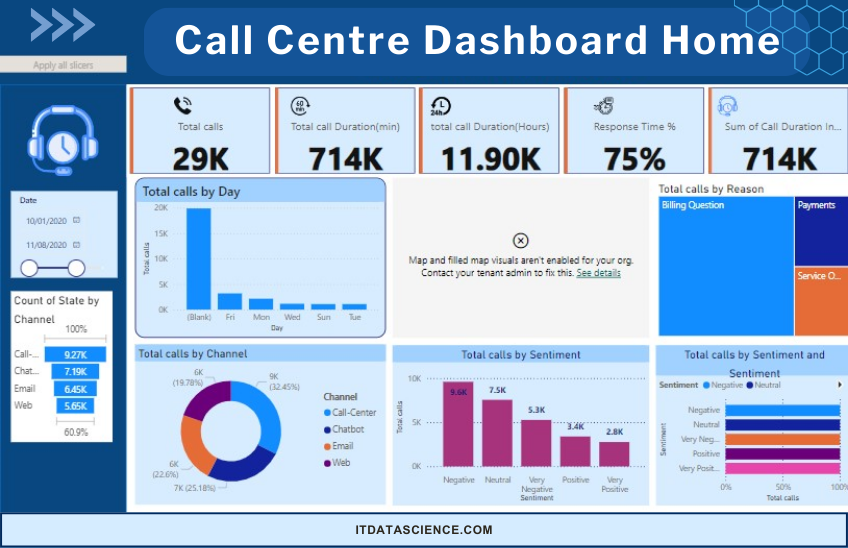
Majority of calls are concentrated on specific days and channels
Billing and payment-related queries dominate the call reasons
Positive customer sentiment is less frequent, indicating areas for improvement in customer service
Role: Responsible for data visualization, analysis, and dashboard creation
Data source: Internal call center data
Dataset: Data includes call logs with attributes such as call date, duration, reason, channel, and sentiment
Description: This project involved creating a comprehensive dashboard to analyze call center operations. The dashboard visualizes total calls, call durations, response times, and customer sentiment, allowing for in-depth analysis of service performance. It also offers insights into call distribution by day, channel, and reason, helping managers make informed decisions to optimize customer service.